 Traydzee
See what's really inside a fund or ETF.
Past the label — the actual holdings, the concentration, the cost, and how it stacks up against similar funds.
use it when — You're about to buy a fund and want to know what you're actually holding.
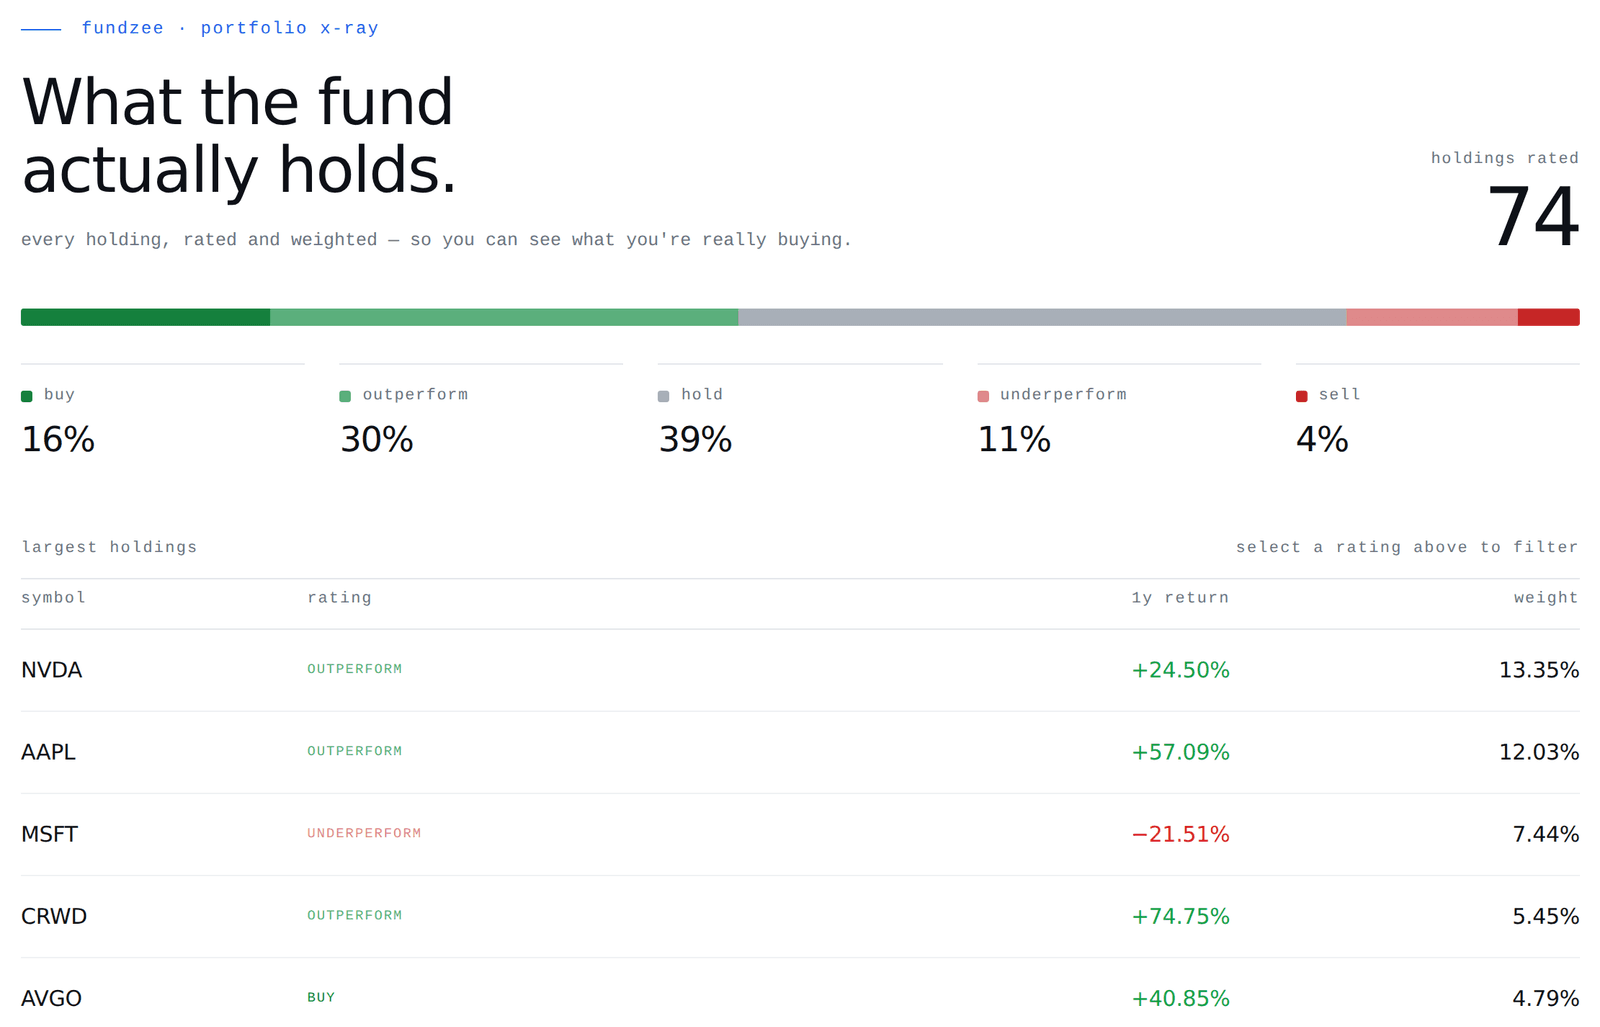
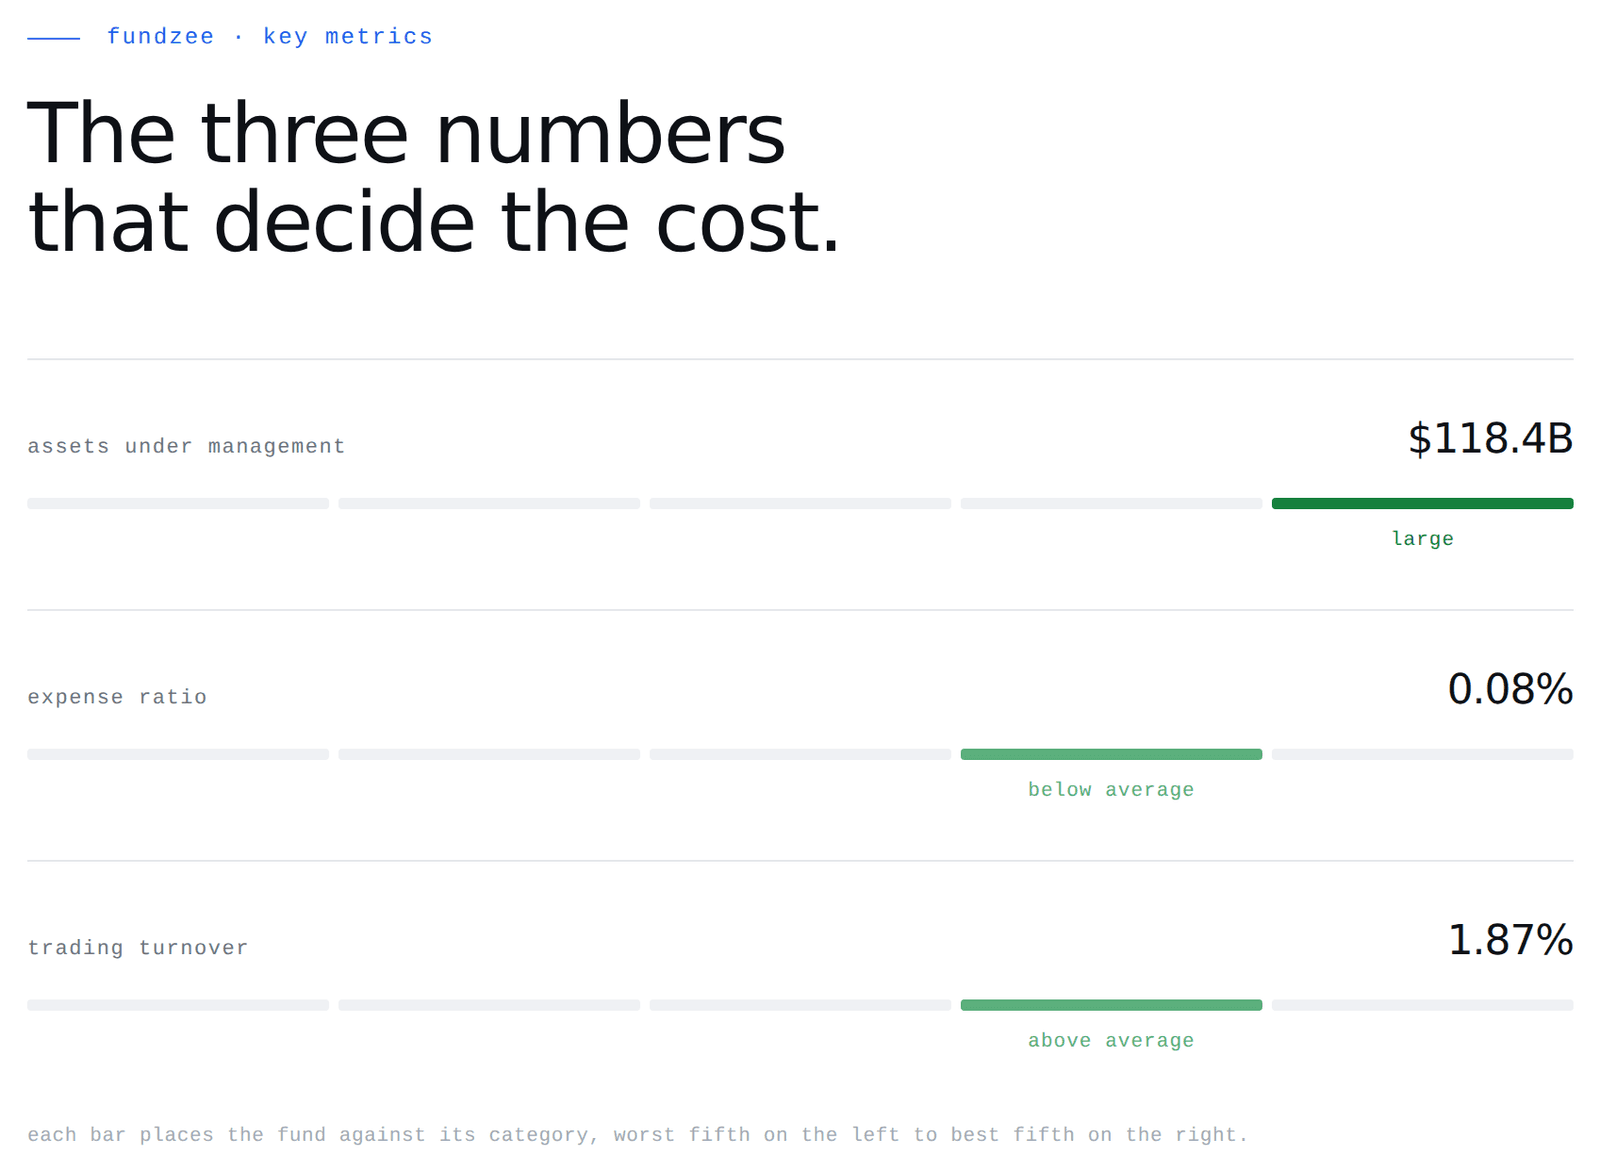
Illustrative output. Figures shown are examples, not live data or a recommendation.
Four things, every time.
What you actually own
The real holdings underneath the label — broken down by sector, industry, and country, not just the fund's marketing category.
Every holding, rated
Not just a list — each underlying holding carries its own rating, so you can see how much of the fund is sitting in Buy-rated names vs. Hold or Underperform.
The cost, made obvious
The expense ratio stated plainly, and how it stacks up — cheap, average, or expensive against similar funds.
Concentration and risk
Whether a "diversified" fund is actually diversified — or 40%+ of it rides on three or four companies.
Here's the x-ray on a tech ETF
- 01
You look up a fund — say, a semiconductor-heavy tech ETF.
- 02
FundZee breaks down what's inside: 44% semiconductors, 23% software, and its top 3 holdings alone make up 42% of the fund.
- 03
It shows the real fee (0.09%, rated "Below Average" against peers) and where it ranks — cheapest, largest, best 1-year return.
- 04
You see the concentration and the cost up front, not after the fact.
How does FundZee rate a fund?+
An overall score out of 100, built from risk, performance, and portfolio factors — plus a plain-English rating such as Exceptional, Above Average, or Neutral.
Will it tell me which fund is better?+
It shows you how funds compare — on size, cost, one-year return, and risk-adjusted return — so you can see where each actually stands rather than how it is marketed. Which one is better for you depends on your circumstances, which Traydzee does not know.
Can I compare more than one fund?+
Yes. You can x-ray a fund on its own, or line up to 10 at once to see exactly where they differ.
Does it cover ETFs and mutual funds?+
Both — 12,000+ funds and ETFs. If it publishes its holdings, Traydzee can read them.
Try x-ray a fund or etf free.
No credit card required · When the trial ends you're not charged — keep a free limited plan or upgrade anytime